For Auditing and Troubleshooting issues in an application, log data is very useful. And to make it easy to read the log data via some kind of tool will make developers and maintainers happy. However, not all the log data for any event is not needed to be stored in the log record. Means, Each log record should have only the information needed for further notice or further debugging. Strictly all sensitive data should be not logged for any application.
What data to Log
In case of Drupal 8 application, which had the database logging feature within the core. Also has a logging class to write any custom logs to the database. Logging to database and querying from database is not an efficient way if we are talking about mid-sized or large applications.
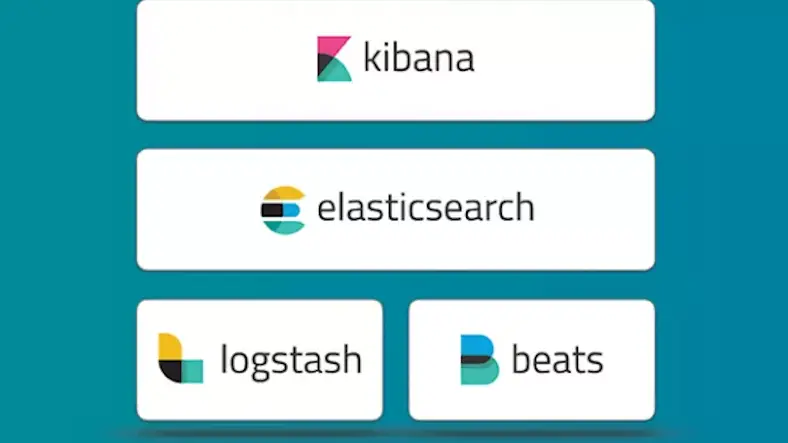
A better and more efficient way to write and read logs would be using ELK stack, where Logstash ingests data from a multitude of sources in our case apache and php logs, transforms it and then sends Elastic search. And Kibana (UI) provides an interface to search logs and also create visualizations.
Create two streams of logs, one for apache logs and other of php logs, where logs are in these locations in docker containers.
- Apache logs /var/logs/apache2/error.log
- Php logs /var/log/php.log
Tweak php.ini file and add error_log=/var/log/php.log. So that logs will get stored to php.log file inside the docker container.
For logging the data in a readable format, use the following line formatter.
Whatever data you are processing to the context variable, will be in the readable format. And it's logged in as audit logs and error logs.
Send logs via Filebeat to Logstash or Elasticsearch
Use Filebeat, to move the logs created by Elastic which will tail the log file data and further send to logstash or Elasticsearch. Install the filebeat and configure it to track the log files.
In the output configuration section, the logstash host with port number is mentioned. By this the logs should be showing up on the Kibana.. If not, make sure the filebeat agent is running.
Monitoring the Logs via Kibana
On Kibana, Available fields are the indexed items which can be used as columns and also in search. You can filter logs by fields USER-ID. And each log record can be seens as a json value by expanding the _source.
You can also create Dashboards and Visualizations which can have specific data logs and also filter by fields.


![OnePlus Buds Pro 3 Bluetooth TWS in-Ear Buds - Dual Drivers, Dual DACs, Dynaudio EQs, Up to 50dB Adaptive Noise Cancellation, Up to 43Hrs Battery [Lunar Radiance] OnePlus Buds Pro 3 Bluetooth TWS in-Ear Buds - Dual Drivers, Dual DACs, Dynaudio EQs, Up to 50dB Adaptive Noise Cancellation, Up to 43Hrs Battery [Lunar Radiance]](https://m.media-amazon.com/images/I/61dVOVxHn3L._SX679_.jpg)


