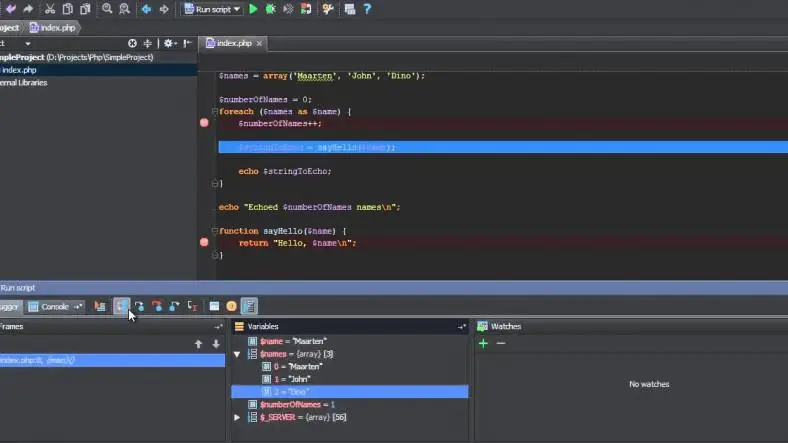
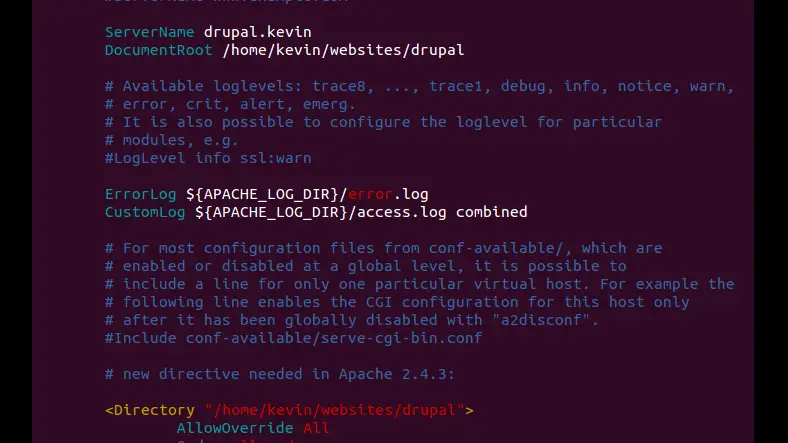
Debugging the code is one of the important process for a developer, So now this article will help you to configure the Phpstorm for debugging the Drupal 7 application with the help of xDebug.
The configuration made in this article refers specifically to the Ubuntu machine, which has Apache2 webserver running and xDebug installed.
- Initally open terminal and check the php version
$ php -v
- you will get the following output
PHP 5.6.12-1+deb.sury.org~trusty+1 (cli)
Copyright (c) 1997-2015 The PHP Group
Zend Engine v2.6.0, Copyright (c) 1998-2015 Zend Technologies
with Zend OPcache v7.0.6-dev, Copyright (c) 1999-2015, by Zend Technologies
with Xdebug v2.3.2, Copyright (c) 2002-2015, by Derick Rethans
- In my case, since xdebug is already installed, it showing xdebug else you should install the xdebug., follow below command to install xdebug.
$ pecl install xdebug
- Next find the path of the file where
xdebug.sois located, you can find by this command$ locate xdebug.so - Next, you got to the
php.inifile, in my case its located in/etc/php5/apache2/php.iniOr to find where its is located you can find by this command$ locate php.ini - Next, you need to add below lines to the
php.inifile
zend_extension="/usr/lib/php5/20131226/xdebug.so" xdebug.remote_port="9001" xdebug.remote_enable="1" xdebug.idekey="PHPSTORM"
- Next, Open PhpStorm → File → Default Settings → In the search box search with debug, Change Debug port to 9001, apply and ok.
- Again Open File → Default Settings → Search for IDE Key, Set IDE key as PHPSTORM, Apply and OK
- Next, Goto you browser, install an Xdebug helper extension.
- Once you have enabled extension then you need to add Debugger bookmarklets for chrome. Go to https://www.jetbrains.com/phpstorm/marklets/ page and Generate XDebugger bookmarks. - Note: IDE key should be PHPSTORM, as we set in PhpStorm settings.
- Now Drag and drop - Start debugger and Stop debugger to your browsers bookmarks Bar.
- Now its time to debug our drupal 7 site with phpstorm and your browser.
- Open PhpStorm with drupal project and click Start listen for PHP Debug connections (These option are at Top Right corner of your phpstorm)
- Now open your browser and click on Start debugger in the bookmark toolbar.
- Again, Goto phpstorm. Now add breakpoint in index.php file.
- Next, Again visit your browser and load any page (localhost/drupal7). For the first time phpstorm you will ask be asked for confirmation dialogue box to accept connection from browser. Once you accept it, you will be automatically taken to you phpstorm's breakpoint.
In this way you can put multiple breakpoints and debug the code.
Thanks for reading the article, for more drupal related articles, check out here.


