Xdebug Profiling is all about measuring the performance of PHP code. In this article you gonna see how your measure the performance of your php code using webgrid and the xdebug.
Requirements:
- Xdebug, with profiler enabled
- Webgrind
- Xdebug Addon plugin for browser
1. Xdebug with profiler enabled
For setting up the environment, edit the php.ini file and add following lines.
xdebug.profiler_enable_trigger = 1
If you want the cachegrind in a prefered location, then add the following
xdebug.profiler_output_dir="/var/www/html/xdebug_profiler"
If you want a prefered name, add below line of code
xdebug.profiler_output_name="cachegrind.out.%u.%H_%R"
Once added, restart the web server in my case
service apache2 restart
Once you restart the server, visit the index page where you have PHPInfo with profiler enabled, as shown in the image.

2. Webgrind
For installing the webgrind, download the latest version from the below url
https://code.google.com/archive/p/webgrind/downloads
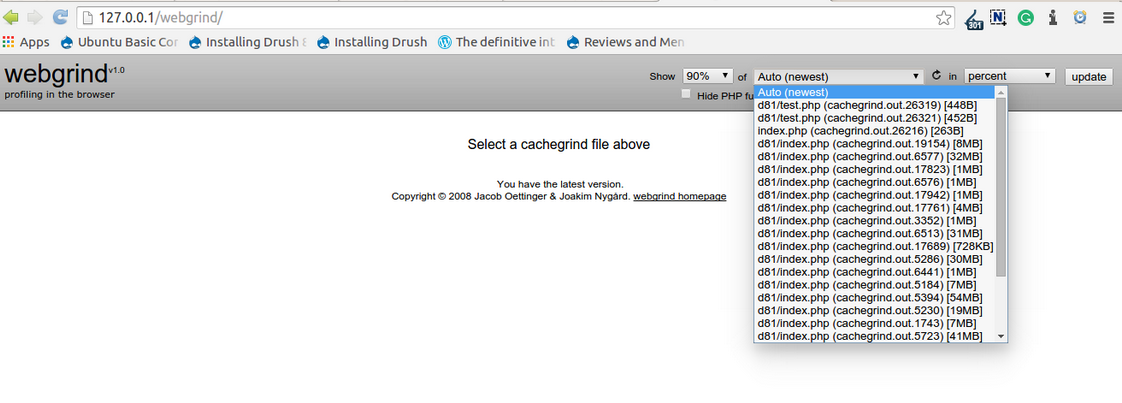
Extract it and put in the root folder of your web server. When you hit the localhost you will be able to see the running webgrind. In my case I have the existing cache grinds

3. Xdebug Addon plugin
Next we go to installing the xdebug plugin. First download and enable the plugin,

Once done, you will be able to see the icons shown in the below image on your browser.

Enable the Xdebug trace as shown in the image.
Now let's check the performance.
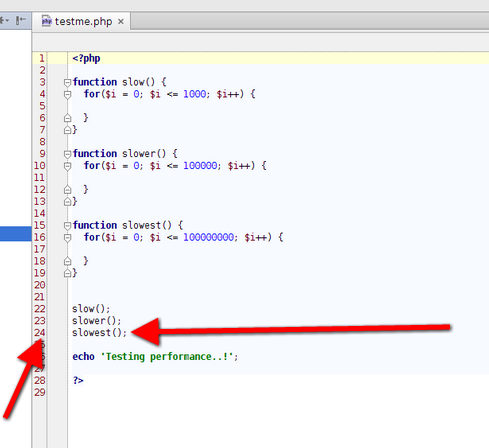
To do this initially we write a test code in a testme.php We have 3 for loops in our case, which runs heavily when compared to the rest.The 3rd one will be slowest one in our case,So this should be shown by our webgrind

Run the testme.php code by hitting the url with the parameter XDEBUG_PROFILE=on

Now visit the webgrind at you localhost and select the testme.php‘s cache grind.
You will be able to see the output as shown in image

As shown in the above image
In line 24 of testme.php the time consumed is 99.84 percent of you entire testme.php time execution.
So in Drupal case also hit the page url as shown below where we are hitting the node/4 with XDEBUG_PROFILE=on

Visit the webgrind on localhost, where one more cache grind will be created for drupal one.

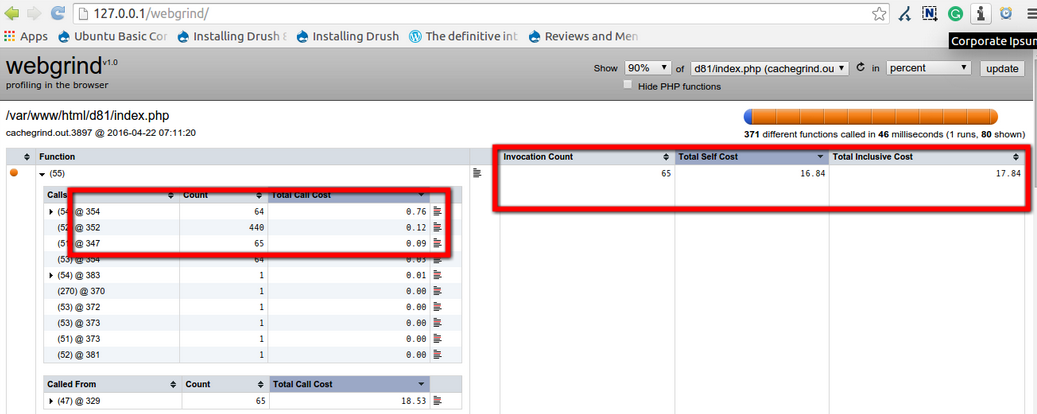
Similarly as in the test.php case, we can see at which particular line the code is taking the more time.
Conclusion
In this manner we can check for the specific piece of code which is taking more time to execute and optimize that particular piece of code. Additionally, you can see the hierarchy of all function calls and follow the same steps to check for the root function performance.
Thanks for reading the article, for more drupal related articles read and subscribe to peoples blog articles.


